


题目信息
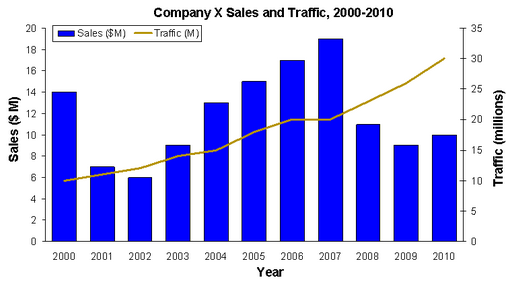
The graph shows the total sales for Company X and its traffic (in millions of unique visitors) for each of the years 2000-2010.
From each drop-down menu, select the option that creates the most accurate statement based on the information provided.
A) The percent decrease in the total sales from 2007-09 was approximately %.
B) The amount of dollar sales per unique visitor increased by approximately from 2002 to 2007.
参考答案及共享解析

共享解析来源为网络权威资源、GMAT高分考生等; 如有疑问,欢迎在评论区提问与讨论
本题耗时:
已选答案:
正确答案:
50;
0.5;
权威答案解析正在整理中,即将上线。


 加入收藏
加入收藏
 在线答疑
在线答疑
题目来源