


题目信息
Apple Stock Price
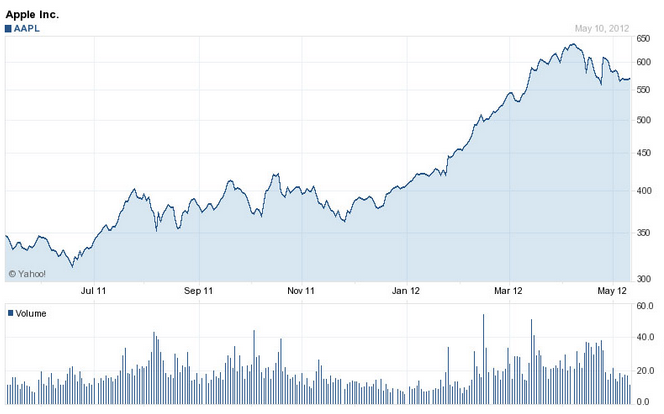
The stock chart to the left shows the price of Apple stock from the May 2011 to May 2012. The corresponding bar graph on the bottom displays the average daily volume for Apple stock on any given day. For example, if 1 million shares of Apple were traded on a particular day where Apple was roughly at $100 per share, then $100M worth of Apple stock was traded that day.
A) The dollar ($) amount of Apple stock that was traded per day near the trough of the stock in June of 2011 was closest to of the dollar amount of Apple stock that was traded just after the stock peaked in April of 2012 and trended lower.
B) How many of Apple's 75 percentage point increase in stock price from Dec 2011 to the peak in April 2012 was erased by the following decline from 630 to 555?
参考答案及共享解析

共享解析来源为网络权威资源、GMAT高分考生等; 如有疑问,欢迎在评论区提问与讨论
本题耗时:
已选答案:
正确答案:
29%;
21%;
权威答案解析正在整理中,即将上线。


 加入收藏
加入收藏
 在线答疑
在线答疑
题目来源