


题目信息
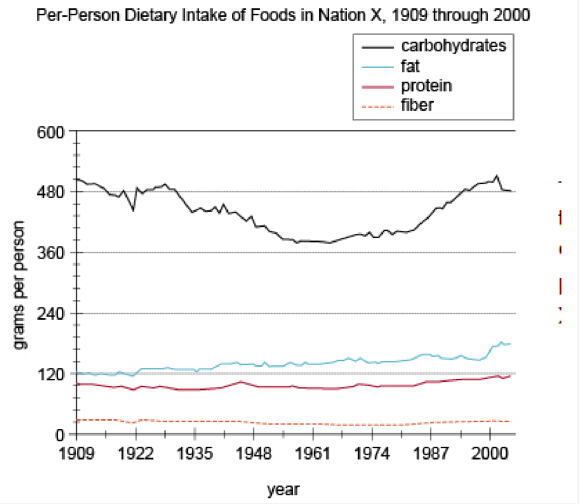
The graph depicts the per-person dietary intake of foods in 4 categories for the people of Nation X for the years 1909 through 2000. A decline in consumption in all 4 categories strongly suggests an overall food shortage rather than a simple change in dietary pattern.
From each drop-down menu, select the option that creates the most accurate statement about food consumption in Nation X based on the information provided.The graph suggests that Nation X most likely experienced a food shortage shortly before the year
For the year that the total dietary intake of carbohydrates was lowest, the per-person intake of carbohydrates was approximately times the per-person intake of dietary fiber.
参考答案及共享解析

共享解析来源为网络权威资源、GMAT高分考生等; 如有疑问,欢迎在评论区提问与讨论
本题耗时:
已选答案:
正确答案:
1922;
18;
权威答案解析正在整理中,即将上线。


 加入收藏
加入收藏
 在线答疑
在线答疑
题目来源