


题目信息
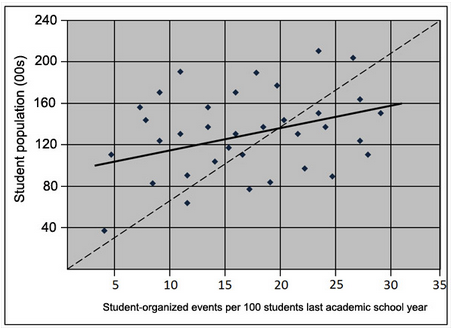
The graph displays data points corresponding to the number of students in a university campus and the number of student-organized events held per 100 students in one academic calendar year. All information present represents events that occurred during the last school year beginning in September. The dashed line runs through points (0,0) and (35,240). A total of 35 universities were surveyed.
Use the drop-down menus to fill in the blanks in each of the following statements based on the information given by the graph.
A) The number of universities that had at least 20 student-organized events per 100 students is aboutof the total number of universities surveyed.
B) The dashed line has a slope that isthe slope of the regression line.
参考答案及共享解析

共享解析来源为网络权威资源、GMAT高分考生等; 如有疑问,欢迎在评论区提问与讨论
本题耗时:
已选答案:
正确答案:
33%;
greater than;
权威答案解析正在整理中,即将上线。


 加入收藏
加入收藏
 在线答疑
在线答疑
题目来源