


No
Yes
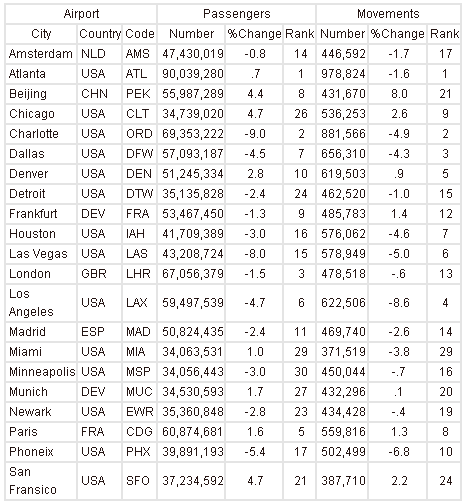
The airport that lost the greatest percentage of passengers from 2007 to 2008 also lost the greatest percentage of movements.
The top ranked airport in movements had more total passengers than did the 2 lowest ranked airports
More than 1 airport experienced a decline in passengers but an increase in movements during the year.


 在线答疑
在线答疑