


题目信息
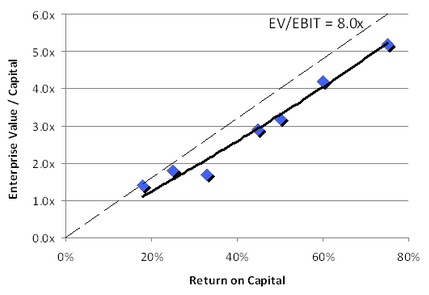
The graph here is a scatter plot of 7 points, each representing a company's return on capital and EV/Capital ratio in the fictitious Widgets industry.
Return on Capital is defined as EBIT (Earnings Before Interest and Taxes) divided by Capital (or EBIT/Capital).
The slope provided is y-axis over x-axis; here the slope is (EV/capital) / (EBIT/captial) = EV/EBIT. An EV/EBIT slope of 8.0x is drawn as a dotted line.
Use the drop-down menus to fill in the blanks in each of the following statements based on the information given by the graph.
A) Among the companies listed, if a company had a ROC % no more than 40%, it had EV/Capital ratios of no more than.
B) Referencing the 8.0x EV/EBIT slope, the appropriate EV/EBIT multiple for the Widgets industry is most closest to.
参考答案及共享解析

共享解析来源为网络权威资源、GMAT高分考生等; 如有疑问,欢迎在评论区提问与讨论
本题耗时:
已选答案:
正确答案:
2.0x;
6.8x;
权威答案解析正在整理中,即将上线。


 加入收藏
加入收藏
 在线答疑
在线答疑
题目来源