


题目信息
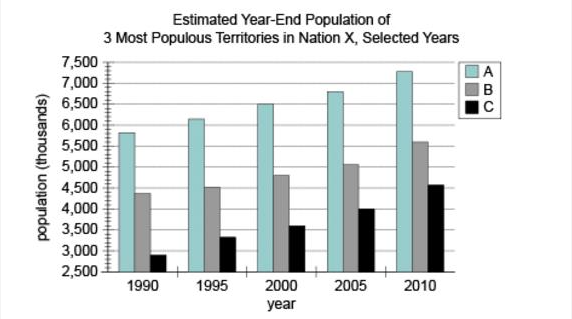
The graph shows the estimated year-end population for the 3 most populous territories in Nation X in 5 selected years. The estimated year-end population of Nation X was 17,000,000 in 1990 and 22,500,000 in 2010.
For each drop-down menu, selected the option that creates the most accurate statement based on the information provided.
The increase in the estimated year-end population of Territory C from 1990 to 2010 accounts for approximately % of the increase in the estimated year-end population of Nation X over the same period.
In 2010, the estimated total year-end population of the 3 territories was of the estimated year-end population of Nation X.
参考答案及共享解析

共享解析来源为网络权威资源、GMAT高分考生等; 如有疑问,欢迎在评论区提问与讨论
本题耗时:
已选答案:
正确答案:
30;
between 70% and 80%;
权威答案解析正在整理中,即将上线。


 加入收藏
加入收藏
 在线答疑
在线答疑
题目来源