


题目信息
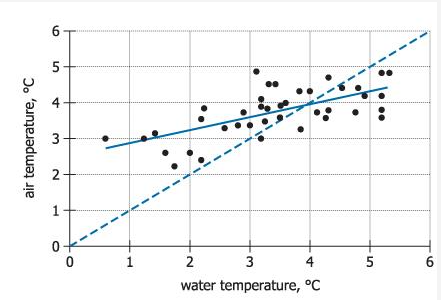
The graph at the left is a scatter plot with 40 points, each representing the temperature of the ocean water, measured at a fixed location off the coast of West Iceland, and the air temperature, measured on land at a fixed location in West Iceland. Both the water temperature and the air temperature, in degrees Celsius, were measured at noon on Wednesday of each of 40 consecutive weeks last year. The solid line is the regression line and the dashed line is the line through the points (0,0) and (6,6).
The relationship between the water temperature and the air temperature is .
The slope of the regression line is the slope of the dashed line.
参考答案及共享解析

共享解析来源为网络权威资源、GMAT高分考生等; 如有疑问,欢迎在评论区提问与讨论
本题耗时:
已选答案:
正确答案:
positive;
less than;
权威答案解析正在整理中,即将上线。


 加入收藏
加入收藏
 在线答疑
在线答疑
题目来源