


题目信息
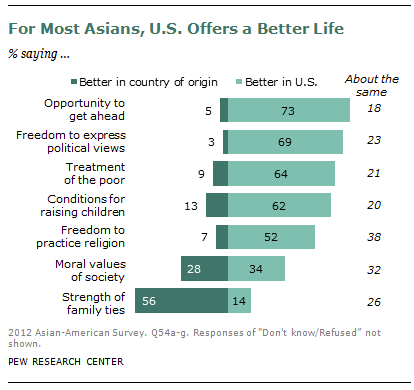
The graph to the left shows the results of a survey of Asian Americans and their perspective on life in America. Respondents who replied "Don't know" are not included in the chart. Note the lifestyle aspect of Strength of family ties provides an outlier data point relative to other lifestyle categories.
A) The average (arithmetic mean) of the percentage of respondents that said a particular lifestyle aspect was better in their country of origin waspercentage points higher with the inclusion of the skewed outlier data point than it was without the inclusion of the skewed outlier data point.
B) On average, the number of respondents who did not respond for each of the lifestyle categories was
参考答案及共享解析

共享解析来源为网络权威资源、GMAT高分考生等; 如有疑问,欢迎在评论区提问与讨论
本题耗时:
已选答案:
正确答案:
6.4;
less than 5%;
权威答案解析正在整理中,即将上线。


 加入收藏
加入收藏
 在线答疑
在线答疑
题目来源