


题目信息
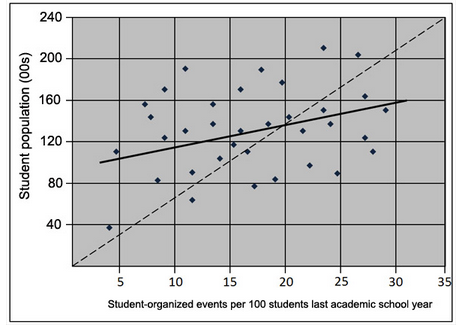
This graph plots some data of the number of student-organized events on campus in a particular calendar year. The metrics used on the X-axis is events per 100 students. This is plotted against the total student population of that university campus. There is a dashed line that runs from the origin (0,0) to the upper right of the graph corresponding to 35 student events and 24,000 students.
A) According to this chart, a university with more than 10 student-organized events per 100 students isto have a student population of at least 12,000 people.
B) The school with the smallest student body was also the school with the fewest student-organized events per hundred students.
参考答案及共享解析

共享解析来源为网络权威资源、GMAT高分考生等; 如有疑问,欢迎在评论区提问与讨论
本题耗时:
已选答案:
正确答案:
more likely;
Ture;
权威答案解析正在整理中,即将上线。


 加入收藏
加入收藏
 在线答疑
在线答疑
题目来源