


题目信息
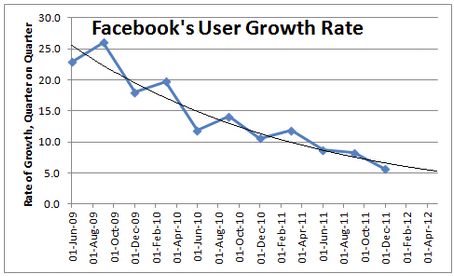
This is a Time VS QoQ Rate of Growth chart for Facebook between June 2009 and April 2012 - just before its IPO in May 2012. The dotted line shows actual data while the smooth line shows an estimated regression of those data points.
Choose the appropriate drop down that best fills in the sentence with accurate information about the graph.
A) The quarter over quarter growth rate tookmonths to fall from the 10%-15% range down to the 5%-10% range.
B) The graph shows there tends to be a seasonal effect on the decline of Facebook's rate of growth during the time period shown.
参考答案及共享解析

共享解析来源为网络权威资源、GMAT高分考生等; 如有疑问,欢迎在评论区提问与讨论
本题耗时:
已选答案:
正确答案:
12 months;
Ture;
权威答案解析正在整理中,即将上线。


 加入收藏
加入收藏
 在线答疑
在线答疑
题目来源