


题目信息
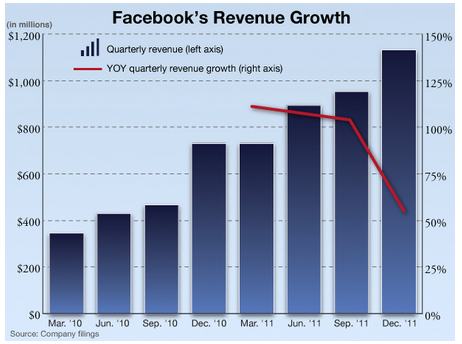
This is a bar graph of Facebook's revenue growth from the beginning of 2010 to the end of 2011. The left axis corresponds with the bars illustrating Facebook's revenue in millions. The right axis illustrates the year over year quarterly revenue growth rate beginning in the quarter ending March 2011.
Use the drop-down menus to fill in the blanks in each of the following statements based on the information on the chart.
A) Facebook earnedmore in 2011 than it did in 2010.
B) Facebook's revenue for the Mar'12 quarter would have to beif the year over year growth for that quarter is at 50%.
参考答案及共享解析

共享解析来源为网络权威资源、GMAT高分考生等; 如有疑问,欢迎在评论区提问与讨论
本题耗时:
已选答案:
正确答案:
$1.7B;
$1.1B;
权威答案解析正在整理中,即将上线。


 加入收藏
加入收藏
 在线答疑
在线答疑
题目来源